05.01.2017
Evaporative cooling app from Condair - myCoolblue
Condair has developed a new app that accurately determines how much energy could be saved by using in-duct exhaust air evaporative cooling and a heat recovery system, rather than just traditional compressor driven cooling.
Using worldwide weather data from Meteonorm, the myCoolblue app calculates how much energy is needed annually to cool a building. Then, taking into account 10 years of historic weather data from over 300 regions worldwide, the app projects how much cooling each month could be delivered using exhaust air evaporative cooling and how much would still need to be delivered using traditional mechanical cooling.
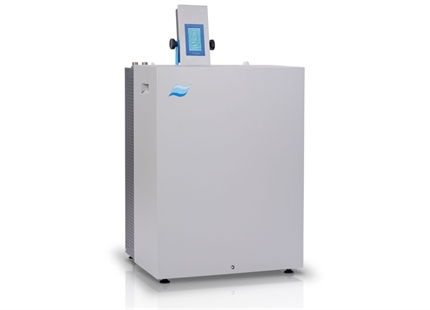
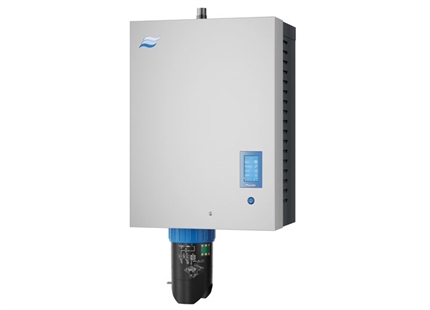
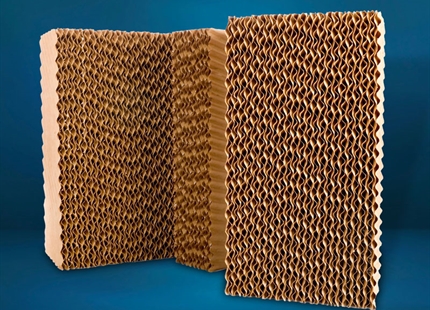
Exhaust air evaporative cooling uses an adiabatic humidifier to cool the return air from a room and a heat recovery unit to transfer the cool thermal energy to the incoming fresh air stream. The technique can provide several degrees of cooling from just a few kilowatts of electricity, reducing a building’s energy bills and carbon footprint.
By assessing how much of a building’s cooling can be delivered with exhaust air cooling, a HVAC consultant or AHU designer can accurately calculate the viability of an in-duct evaporative cooling system and show its return on investment potential.
For instance, Condair’s myCoolblue app shows that for a building in London needing to maintain an internal condition of 23°C during normal office hours, with 2m x 2m AHU and airflow of 2.6m³/s, the typical annual cooling load would be 33,532kWh. Given the 10-year historic weather conditions for London, myCoolblue app shows that, in an average year, an exhaust air evaporative cooling system could deliver 53% of the required cooling.
The app gives energy projections for hot or average summer conditions and takes into account a comprehensive set of variables to provide an accurate calculation for any project. These variables include the type and efficiency of the heat recovery unit being employed, the location of the fans and the humidifier configuration inside the AHU, alongside the actual design conditions and operating parameters of the AHU itself.
A chart showing the monthly breakdown in kWh between mechanical and evaporative cooling is presented, along with a diagram of the system configuration and the temperature course supply/exhaust chart. Project details and calculations can be saved to the cloud and accessed later. An email option also allows reports with all the project parameters to be emailed in a pdf format for future reference.
Condair’s myCoolblue app can be downloaded from the App Store for free and is available for iPad only.

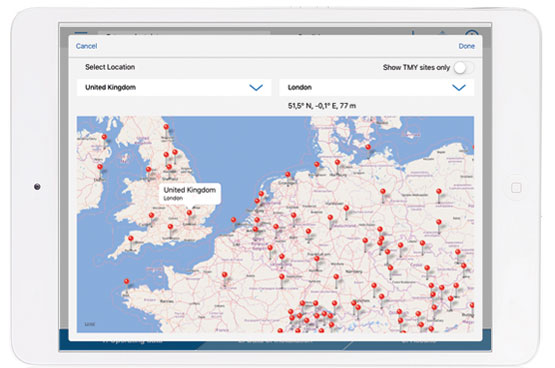
Weather data from over 300 locations is drawn from the Meteonorm database
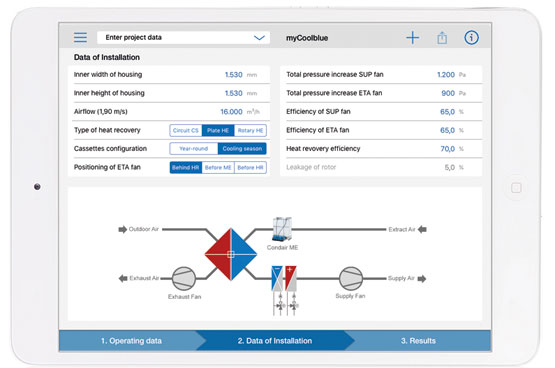
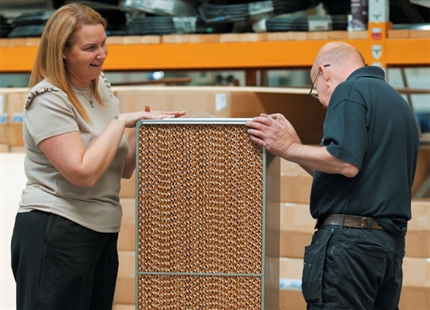
AHU configurations are inputted for the specific project, including many variables

Accurate projections for the amount of exhaust air evaporative cooling vs traditional compressor driven cooling are provided for the AHU given its location's 10-year historic weather conditions